MARKET ENVIRONMENT
share:


In 2019, natural gas prices in Europe fell on average by 39% year on year (based on prices recorded at TTF, GASPOOL, NCG and NBP, and on the Polish Power Exchange), from EUR 23.15/MWh in 2018 to EUR 14.08/MWh. The largest price declines were seen in the Netherlands (TTF) and in the United Kingdom (NBP) – by over 40% on average, and the smallest in Poland (ca. 36%).
Average monthly spot prices of natural gas at selected European hubs
Source: In-house analysis based on ICE data.
In Europe, the air temperatures in winter were generally above the typical range for the season, which depressed the demand for gas used for heating purposes. At the same time, LNG imports to Europe grew strongly, by 60% compared with 2018, driven by lower demand for natural gas in Asia (higher temperatures and lower growth rates of industrial production) and launch of new liquefaction capacities in the US and Russia. LNG from the US was exported to Europe even below the profitability threshold. Meanwhile, demand in Europe grew by 3% in the period. The continued oversupply resulted in pressure on prices, which kept falling across all European markets until September, when it reached the historical monthly low of EUR 9.68/MWh.
In the second half of 2019, gas prices in Europe were affected to a large extent by the high levels of inventories held in gas storage facilities. The uncertainty of future transmission of Russian gas through Ukraine’s infrastructure and the relatively low price led to higher gas injection volumes, with the 90% filling level reached already in August.
The fourth quarter saw an increase in gas prices in Europe, but the average price in that period was 48% lower than in the corresponding period of 2018. This trend was so strong that in the fourth quarter the average price of gas was lower than in the second quarter. Further price declines were halted as electricity production from coal-fired units was being replaced with gas-powered sources. The substitutability of these two energy sources was one of the reasons for a spike in gas demand in Europe in 2019.
Main sources of gas imports to Europe
Source: In-house analysis based on Thomson Reuters data.
The total volume of natural gas imported into Europe in 2019 was 3,690 TWh, of which 45% (1,667 TWh) came from Russia. The share of imports from Russia fell slightly below the 2018 level. The second largest gas supplier in Europe was Norway, with 876 TWh (80mcm), accounting for 24% of the total supplies. Imports from North Africa amounted to 293 TWh (26.5 bcm, 8% of the total supplies), while LNG deliveries to European terminals reached 852 TWh (23% of the imported volumes).
The global LNG trading volume grew by 12% year on year, to over 483 bcm after regasification. This strong increase on 2018 (of 52 bcm) was caused by the launch of new liquefaction capacities, including in Australia, the US and Russia. The largest rises in exports in 2018−2019 were seen in the US – of 20 bcm, while the largest growth in imports, in percentage and value terms, took place in Europe – almost 50 bcm compared with 2018.
| LNG demand and supply in 2018 and 2019, in bcm, after regasification | |||
|
Supply
|
2019
|
2018
|
Change %
|
|
Europe
|
6.6
|
6.6
|
0.0%
|
|
including Norway
|
6.47
|
6.46
|
0.2%
|
|
Asia and Pacific
|
217.4
|
192.88
|
12.71%
|
|
including Australia
|
104.48
|
94.04
|
11.1%
|
|
North and South America
|
73.44
|
52.68
|
39.4%
|
|
including United States
|
49.97
|
29.94
|
66.90%
|
|
Africa
|
59.18
|
53.23
|
11.2%
|
|
Middle East
|
126.55
|
125.97
|
0.5%
|
|
including Qatar
|
105.56
|
105.9
|
(0.32%)
|
|
Globally
|
483.21
|
431.35
|
12.0%
|
|
|
|
|
|
Demand
|
2019
|
2018
|
Change %
|
|
North and South America
|
23.05
|
25.77
|
(10.55%)
|
|
Europe
|
121.39
|
71.81
|
69.04%
|
|
Middle East
|
9.67
|
10.53
|
(8.17%)
|
|
North-East Asia
|
262.88
|
267.00
|
(1.57%)
|
|
including China
|
82.19
|
72.26
|
13.74%
|
|
Globally
|
479.32
|
427.97
|
12.00%
|
| Source: In-house analysis based on Thomson Reuters. | |||
The growing demand for natural gas in Poland is met by domestic production and imports. Gas is transported to Poland via an extensive transmission network, with LNG-derived gas additionally fed into the network since 2016. Gas is traded on the Polish Power Exchange, and distributed physically to end users through distribution and transmission networks. The last component of the national gas system is gas storage facilities.
Consumption of high-methane grid gas in Poland in 2019 (excluding gas fuel supplied on the OTC and PPX markets) was some 183.5 TWh. Compared with 2018, the volume grew by 2.9 TWh, or 1.6% year on year. The increased consumption was a function of greater consumption of gas by new customers connected to the transmission network (up 7.3% year on year) following the launch of new gas-fired generating units. The distribution network demandwas close to that seen in the previous year (-0.3% year on year).
The management of the transmission network and the supply of gas to distribution networks and end users connected to the transmission system are the responsibility of GAZ-SYSTEM. The transmission network comprises the Transit Gas Pipeline System and the National Transmission System (high-methane gas [E group] and nitrogen-rich gas [Lw subgroup]).
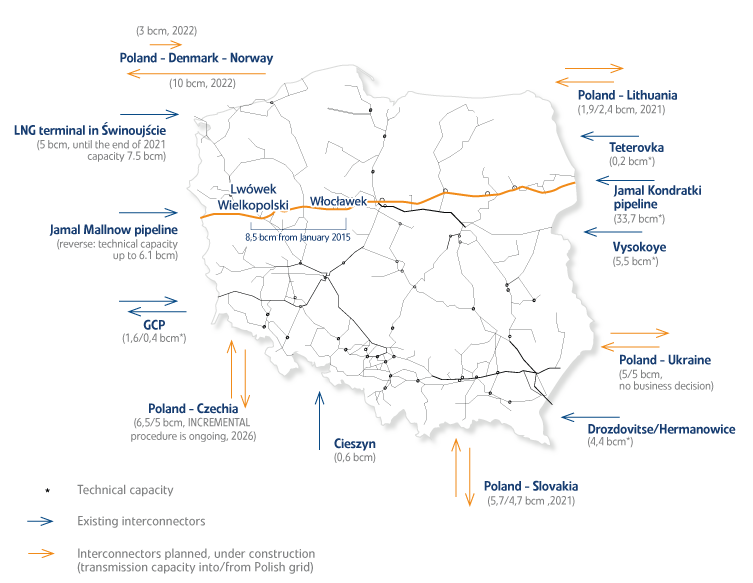
The Baltic Pipe project is a strategic infrastructure project aimed at creating a new gas supply corridor on the European market. It is to enable the transmission of gas directly from deposits located in Norway to markets in Denmark and Poland, as well as to consumers in the neighbouring countries. The annual transmission capacity of the Baltic Pipe will reach up to 10 bcm to Poland and up to 3 bcm to Denmark and Sweden.
GAZ-SYSTEM and Energinet, operators of the Polish and Danish transmission systems who are implementing the project, made a final investment decision in 2018. In 2019, the Polish and Danish operators continued preparations for the construction, which included taking steps to obtain environmental and location decisions and building permits for the individual components of the planned infrastructure. Construction work is expected to from 2020 to 2022. Gas transmission is scheduled to commence on October 1st 2022.
The nominal annual regasification capacity of the LNG terminal in Świnoujście is 5 bcm (after regasification) of natural gas, which is then fed into the transmission network. PGNiG has 100% of the regasification capacity until 2035. In October 2019, Polskie LNG S.A., the operator of the terminal, signed a contract for the purchase of submerged combustion vaporizers (SCV), which will enable it to increase the nominal regasification capacity to 7.5 bcm annually. LNG is also transported by road tankers, and its volumes delivered to the gas network from the terminal, which reach end users in the form of liquefied natural gas (small-scale LNG), are steadily growing.
2019 saw increasing volumes of gas fuel imported to Poland. They reached 183.71 TWh (up by 20.7 TWh, or approximately 12.7%), with a 0.2% decline in gas imported from countries east of Poland and a nearly 40% rise in gas imports from the EU year on year. The majority of imported gas (ca. 54% of total flows) originated from across Poland’s eastern border.
| Gas flows at Poland’s gas grid entry/exit points | |||
|
Entry/exit point (in TWh)
|
2019
|
2018
|
Change %
|
|
Supplies from EU
|
48.79
|
34.82
|
39.94%
|
|
including Lasów, Gubin (GCP)
|
3.97
|
4.33
|
(8.69%)
|
|
including Cieszyn
|
4.70
|
3.89
|
20.14%
|
|
including Mallnow
|
40.12
|
26.60
|
50.80%
|
|
Supplies from across Poland’s eastern border
|
98.75
|
98.83
|
(0.19%)
|
|
including Drozdovitse
|
41.96
|
42.51
|
(1.51%)
|
|
including Teterovka
|
0.86
|
0.87
|
(1.79%)
|
|
including Kondratki
|
23.90
|
22.06
|
8.38%
|
|
including Vysokoye
|
32.04
|
33.39
|
(4.11%)
|
|
LNG regasification
|
36.16
|
29.17
|
23.63%
|
|
Exports to Ukraine (mainly Hermanowice)
|
14.99
|
7.26
|
106.11%
|
|
Total flow
|
198.69
|
170.08
|
16.65%
|
| Source: In-house analysis based on ENTSOG data. | |||
In 2019, the volume of gas regasified at the LNG terminal in Świnoujście increased by 23.6% on 2018 as a result of spot purchases and deliveries under a long-term contract with Cheniere.
In 2019, PGNiG received a total of 18 LNG shipments under the long-term contracts with Qatargas. The volume of LNG imports from Qatar amounted to 1.65m tonnes, i.e. approximately 25.08 TWh or 2.29 bcm of natural gas after regasification. In 2019, PGNiG purchased gas under ten spot contracts; its volume totalled 0.61m tonnes, i.e. ca. 9.34 TWh or 0.85 bcm of natural gas after regasification. The spot deliveries were sourced from Norway (three shipments) and the US (seven shipments), and were arranged in cooperation with the LNG trading office in London. In 2019, PGNiG also received two LNG shipments under a medium-term contract with Centrica.
Over 2019, PGNiG imported 31 shipments of LNG via the LNG terminal, with a total volume of 2.46m tonnes, i.e. approximately 3.43 bcm of natural gas after regasification.
The average daily withdrawal of gas from Polish UGSFs over the withdrawal period amounted to 75 GWh in 2019, down 45% on the previous year. In the summer of 2019, gas was injected into storage at an average rate of 127 GWh/d, up 8 GWh/d on 2018.
At the end of 2019, Polish gas storage facilities were filled to approximately 92.3% of capacity, up 26pp on the end of the previous year. Other European markets also saw higher inventory levels at storage facilities: in Germany, they grew to 97% of capacity, from 75% as at the end of 2018.Stan napełnienia magazynów w Polsce w latach 2018–2019
Levels of gas in storage in Poland in 2018–2019
Source: In-house analysis based on Gas Infrastructure Europe and Gas Storage Europe data.
Contracts traded on the PPX in 2018 and 2019
Source: In-house analysis based on PPX data.
PGNiG is the leader of gas trading on the PPX. According to PPX data, in 2019 the total gas trading volume was 146.1 TWh, of which 123.5 TWh was traded on the commodity futures market (RTT). This means that almost 85% of gas trades in 2019 were executed under contracts with maturities of a year, season (summer, winter), quarter, month, and week.
In 2019, the Polish Power Exchange reported a record-high result in the history of its gas trading, and the total volume of gas trades grew by 2.0% relative to 2018. Record trading volumes were also seen on the commodity futures market for gas (RTT): they went up by 3.2% year on year. On the other hand, the volumes on the Day-Ahead Market and the Intraday Market declined on 2018, and stood at 16.9 TWh (down 3.7%) and 5.7 TWh (down 6.3%), respectively.
Commodity futures (RTT) trading volume on the PPX in 2018 and 2019 (TWh)
Source: In-house analysis based on PPX data.